I collected comprehensive and up-to-date launch data from SpaceX’s API and supplemented it with web-scraped information from reliable sources.
I cleaned the collected data by handling missing values, correcting inconsistencies, and standardizing formats.
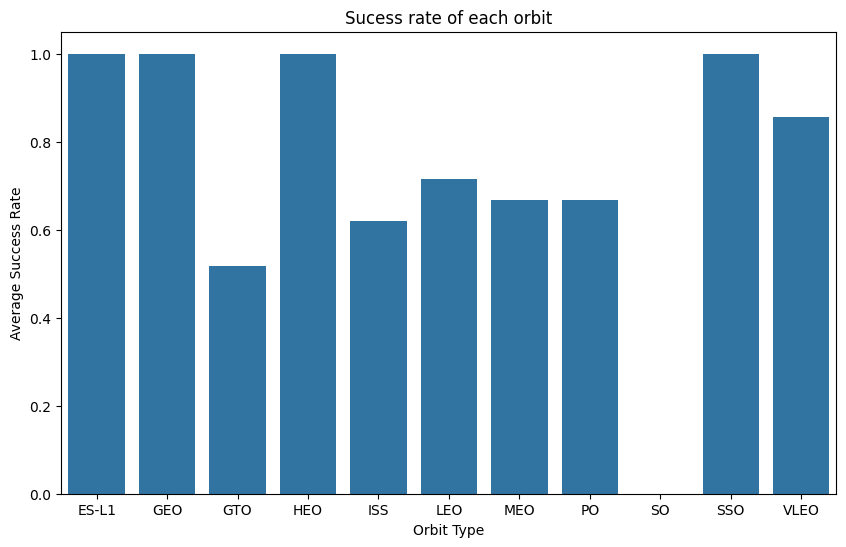
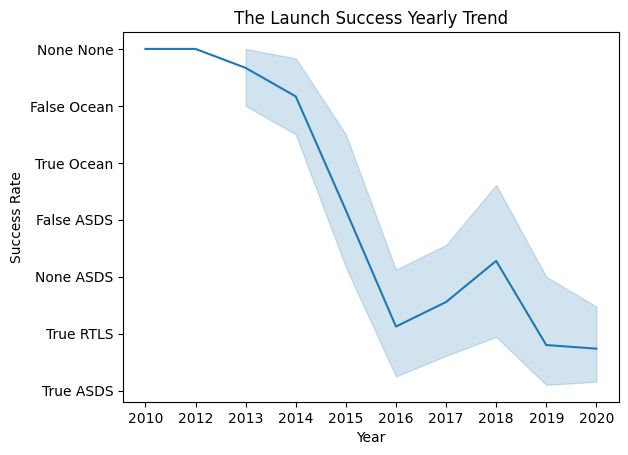
I used SQL and visualization tools like Matplotlib and Seaborn to explore the data, uncovering patterns and key features influencing launch success.
Based on the EDA, I created new features to improve model predictive power by deriving new variables and transforming some features to better capture their relationships with the target variable.
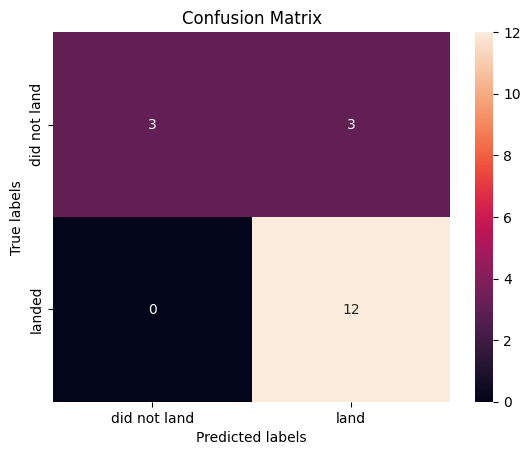
I developed machine learning models, including logistic regression, decision trees, and random forests, to predict launch success, using cross-validation and grid search to tune hyper-parameters and improve performance.