Wild Fires in Australia

Kickstarter

This project analyzes wildfire activities in Australia using a comprehensive dataset. It begins with data preprocessing and exploratory data analysis to understand patterns and trends in wildfire occurrences. The project employs machine learning models to predict wildfire activities, with the results visualized through interactive plots and graphs for better insight and decision-making.

The Details

Data Collection

The project starts by gathering data from multiple sources, followed by cleaning and preprocessing to handle missing values and inconsistencies.

EDA

Visualizations and statistical analyses are performed to identify patterns and trends in the wildfire data. Techniques like time series analysis and geographic mapping are used.

Model

Several models, including regression and classification algorithms, are developed and evaluated to predict wildfire activities. The models are fine-tuned and validated to ensure accuracy.

Visualize

The final stage involves creating interactive visualizations and a dashboard to display the findings, making the results accessible and actionable for decision-makers.

Results and Insights

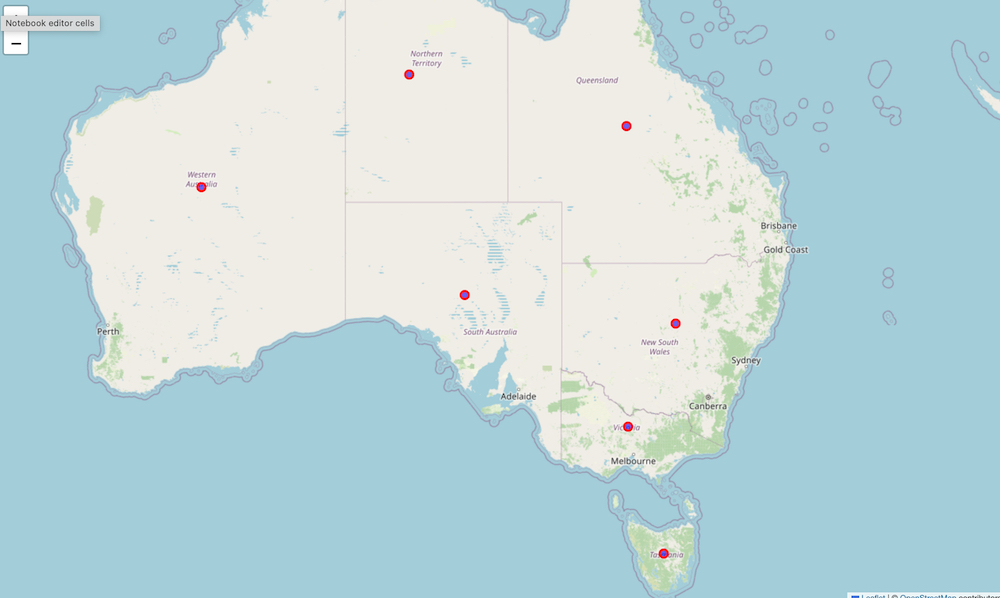
Based on our findings, we discovered that environmental factors like temperature, humidity, and wind speed significantly influence wildfire occurrences. By employing machine learning models, the project accurately predicted wildfire incidents, offering valuable insights for early detection and management strategies.

Estimated Fire Over Time

Plot 1
Plot 2

The first plot highlights a significant peak between 2010 and 2013. The second plot, which uses year grouped with month, shows that the estimated fire area reached its maximum between April 2011 and early 2012. This corresponds to a period of intense wildfire activity in Australia, as confirmed by news reports and Google searches.

The Average Estimated Fire Brightness

Plot 1
Plot 2

The first histogram plot displays the mean estimated fire brightness for the entire country. Plot 2, which shows the mean average brightness by region, reveals that New South Wales had the highest fire brightness, followed by the Northern Territory, with Western Australia having the least brightness among all regions.

Regions Affected by Wild Fires

The map shows the regions in Australia affected by wild fires.

Work

Data

Data, Machine Learning, and AI projects

Artist & Designer

Art gallery, UI/UX, and design collection

Developer

Projects engineered